In the Kanban Guide for Scrum Teams and the Professional Scrum with Kanban workshop, we introduce 4 key flow metrics that we believe Scrum teams can use to improve their flow:
Work in Progress (WIP)
The number of work items started but not finished (according to the Scrum Team’s definition of “Workflow”).
Note the difference between WIP and the WIP Limit. The WIP Limit is a policy that the Scrum Team uses as a “constraint” to help them shape the flow of work. The goal of the WIP Limit is to reduce the amount of actual work in process (WIP). The team can use the WIP metric to provide transparency into their progress towards reducing their WIP and improving their flow.
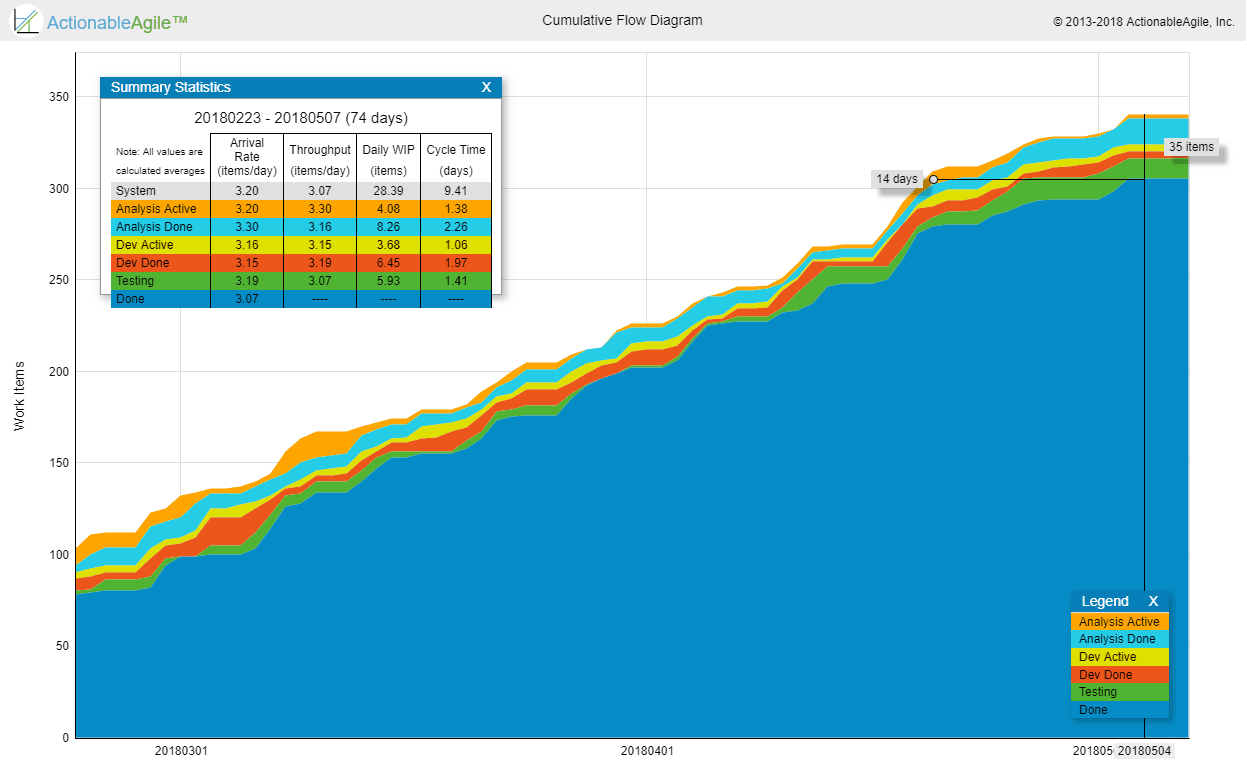
While teams can directly visualize the WIP levels over time (which I recommend), most people use the Cumulative Flow Diagram to visualize the WIP.
Cycle Time
The amount of elapsed time between when a work item “starts” and when a work item “finishes.”
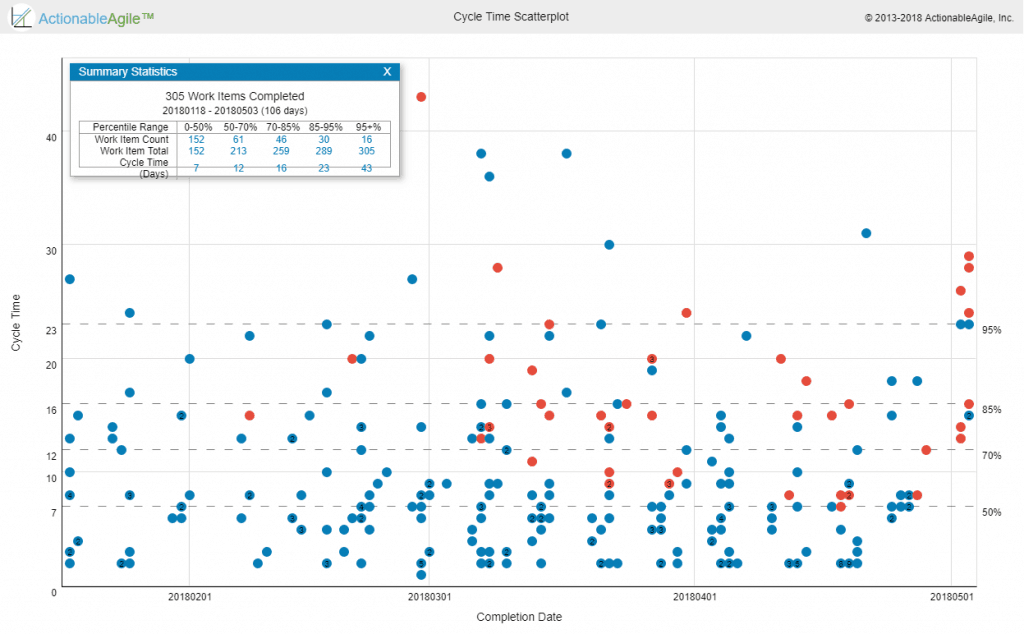
This metric is a lagging indicator of flow. It is available only after an item is actually finished from the workflow perspective (e.g. reached a Done lane on the Kanban board). It is typically used to drive improvement work as well as to be able to establish internal/external expectations as to the team’s turnaround time on specific items. The main chart/report used to visualize and analyze Cycle Times is the Cycle Time Scatterplot where teams can understand their Cycle Time trends, and distributions, and look at anomalies.
Throughput
The number of work items “finished” per unit of time.
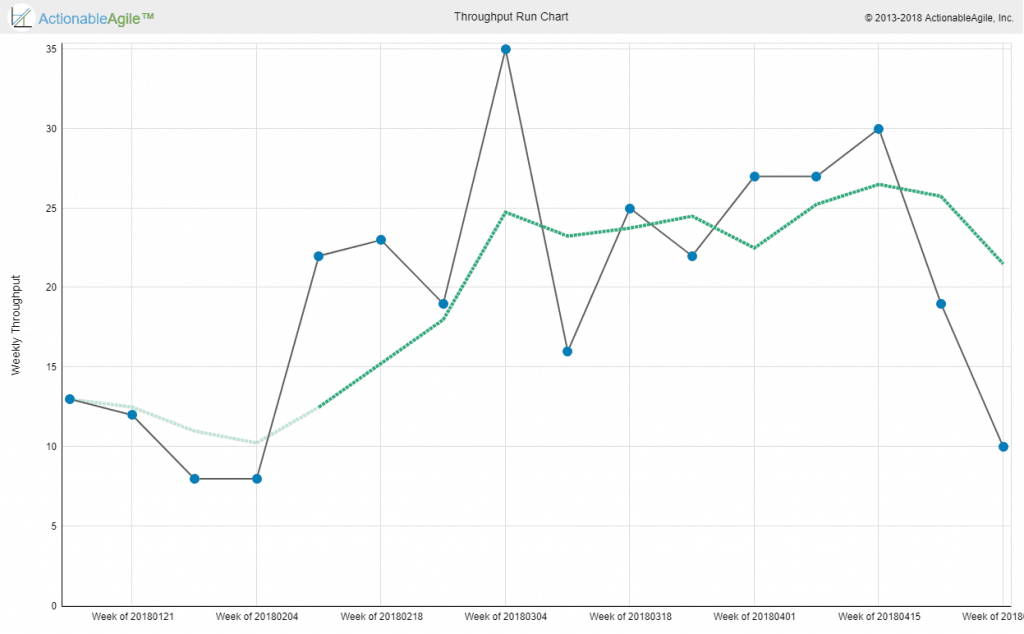
Note the measurement of throughput is the exact count of work items, without any compensation for item size – which is a major difference between throughput and story-points based velocity. Throughput is measured at a certain step in the workflow, typically at the finish line of the workflow. Throughput can be visualized via a separate run chart or by looking at the angle of curves on a Cumulative Flow Diagram.
Work Item Age
The amount of elapsed time between when a work item “started” and the current time.
WIP and Cycle Time are classic metrics every Kanban practitioner is probably familiar with and throughput is somewhat similar to Velocity.
Work Item Age is the new guy on the block. Work Item Age complements Cycle Time. If Cycle Time is a lagging indicator only relevant for finished items, Work Item Age is a leading indicator only relevant for non-finished items. The basic idea is to provide transparency to which items are flowing well and which are sort of “stuck” even if not formally blocked.
I’ve been using some variant of this metric with most Kanban teams I’ve worked with. I also worked with several Kanban tool vendors to introduce some way to visualize card/item age.
Age on its own is interesting but not enough. We also want some indication of flow health. One common thing to visualize is the age in the current step in the workflow also known as “cards that didn’t move recently”.
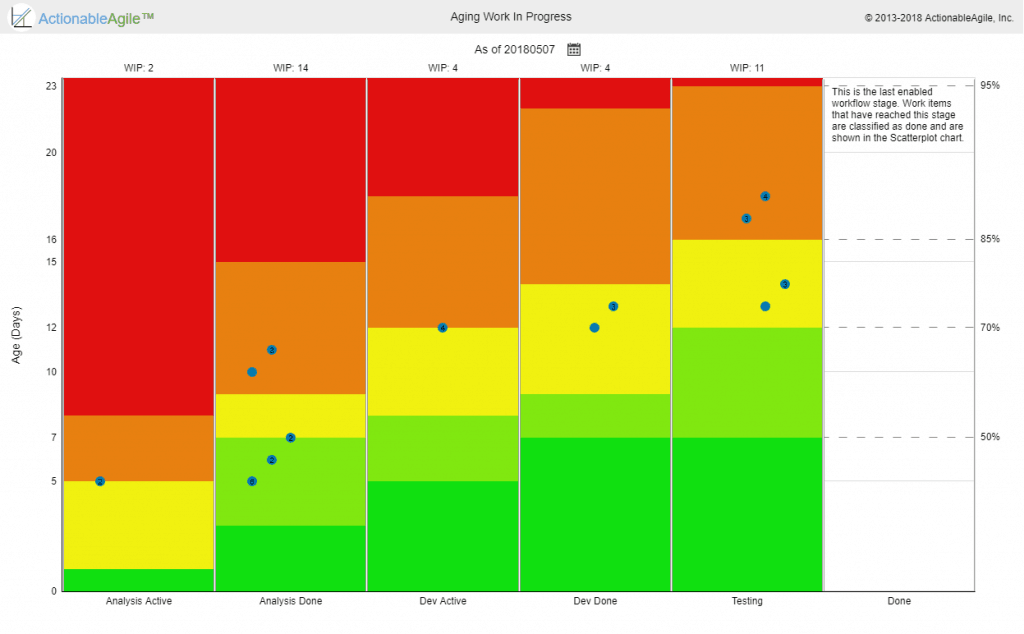
Another way to look at it would be to look at the overall age but combine it with where the work currently is in the workflow as well as what the team expects their cycle time to be (We call that expectation Service Level Expectation (SLE) in the Kanban guide for Scrum teams and the PSK class). Combining all this information can help the team focus on the items that are at the most risk of missing the team’s expectations/SLE. For example, let’s say a team has an SLE of 16 days with 85% confidence. If one of the cards on their board has an age of 10 days, is that ok? is it a problem? The answer is that it depends. If that card is very close to the end of the workflow it is probably not a problem. If it is very close to the start of the workflow it is probably an indication of a problem that requires attention. The “Aging Work in Progress” chart below provides this perspective of both where active items are in the workflow, what the typical cycle times for this team are, and based on that which items are indications of flow risks (obviously orange-red means very low probability of finishing within the team’s flow expectations).
To sum up – Work Item Age is the best metric to look at if you want to determine when an item that has already started is going to finish. This is in contrast to an item that hasn’t started – where your best bet is your historical Cycle Times. The Service Level Expectation is just an expectation set by the team to themselves answering the question “What Cycle Time do we expect to see for an item of this type, and what is our confidence level for this?”.
Note: The charts above were created using the demo version of ActionableAgile Analytics – a tool created by my co-steward of the Professional Scrum with Kanban class – Daniel Vacanti. You can access the demo yourself and play with these metrics and think about how they would help your Scrum team.
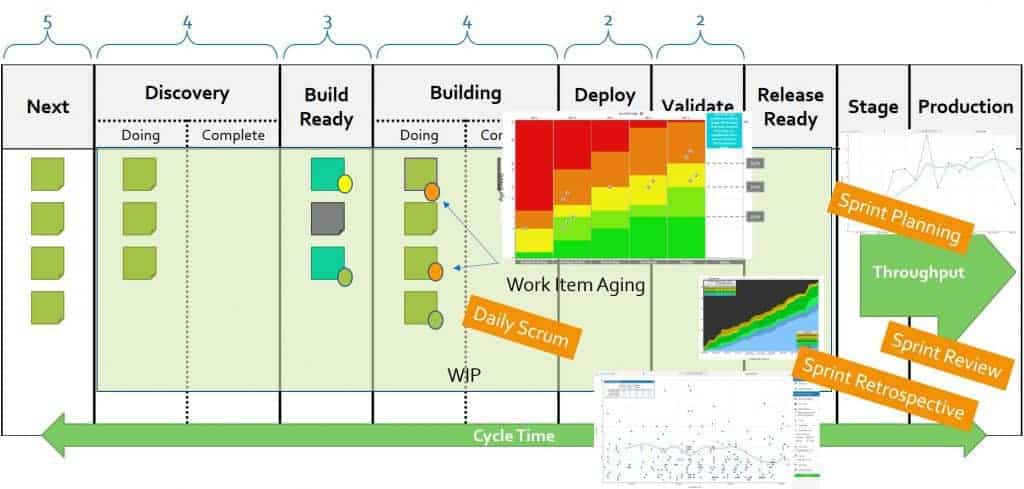
Using the Flow metrics in the Scrum events
So how can these flow metrics be used to improve the Scrum events? This is one of the key learning objectives in the Professional Scrum with Kanban class. In a follow-up discussion with some of the Professional Scrum Trainers who attended last week’s class, we came up with a matrix mapping the metrics to the events. (credit Maarten Kossen)
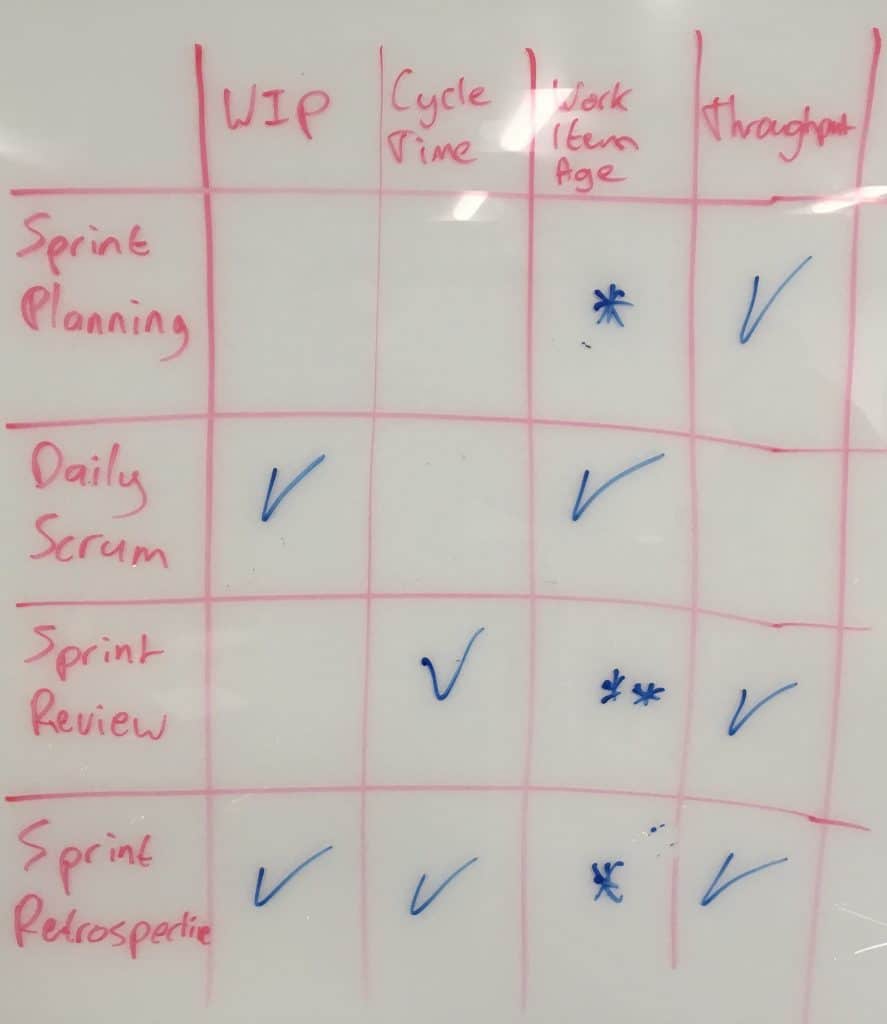
I’ll explain –
Sprint Planning mainly leverages Throughput in order to create a realistic forecast for the Sprint Backlog. Work Item Age might be relevant when you have some items left over from the previous Sprint and you want to decide what to do about them.
The focus of Daily Scrum is the ongoing flow within the Sprint so naturally what we care about is what’s currently going on. Therefore, Current WIP and Work Item Age are the most important metrics in the Daily Scrum.
Sprint Review includes a review with stakeholders of both the Increment as well as overall flow behavior of the team – trends in Cycle Times and Throughput are interesting. Throughput can also be used as part of release planning/road-mapping discussions, especially when combined with Monte-Carlo simulations provide some better visibility/confidence into “What can be done by when”. NOTE: It is always important to emphasize that these are projections/forecasts, not commitments.
Sprint Retrospective is all about inspecting and adapting the process and the workflow. Therefore it is the place to look at WIP, Cycle Times, Throughput from a perspective of looking for areas to improve.
To learn more about flow metrics and how they can be used in a Scrum context, I really recommend joining a Professional Scrum with Kanban class.