The Premise
A year ago Scrum.org, in collaboration with Daniel Vacanti and myself, published the Kanban Guide For Scrum Teams, a guide that is aimed at helping Scrum Teams take advantage of Kanban/Flow principles and practices. (I wrote an earlier blog post about understanding the guide)
SAFe™ has included Kanban at all levels since version 4.0. Some basic guidance about Kanban is included in most if not all SAFe curriculums. Can a SAFe practitioner learn anything from the Kanban Guide For Scrum Teams?
In this blog post, I’ll explore some of the flow metrics from the guide with an emphasis on those that aren’t covered in SAFe.
Scrum with Kanban Flow Metrics
Work in Progress (WIP)
The number of work items started but not finished
Note the difference between WIP and the WIP Limit. The WIP Limit is a policy that Agile Teams use as a “constraint” to help them shape the flow of work. The goal of the WIP Limit is to reduce the amount of actual work in process (WIP). The team can use the WIP metric to provide transparency into their progress towards reducing their WIP and improving their flow.
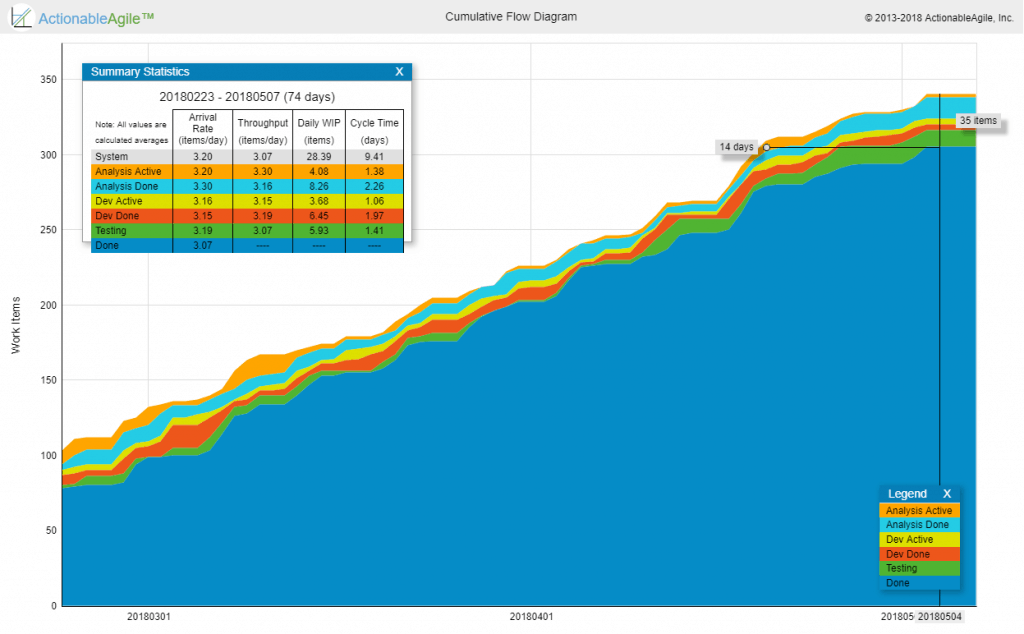
While teams can directly visualize the WIP levels over time (which I recommend), most people use the Cumulative Flow Diagram to visualize the WIP. Visualizing and reducing WIP levels is mentioned in SAFe but it never hurts to repeat it since it’s such an important flow metric to pay attention to.
Cycle Time
The amount of elapsed time between when a work item “starts” and when a work item “finishes.”
This metric is a lagging indicator of flow. It is available only after an item is actually finished from the workflow perspective (e.g. reached a Done lane on the Kanban board). It is typically used to drive improvement work as well as to be able to establish internal/external expectations as to the team’s turnaround time on specific items.
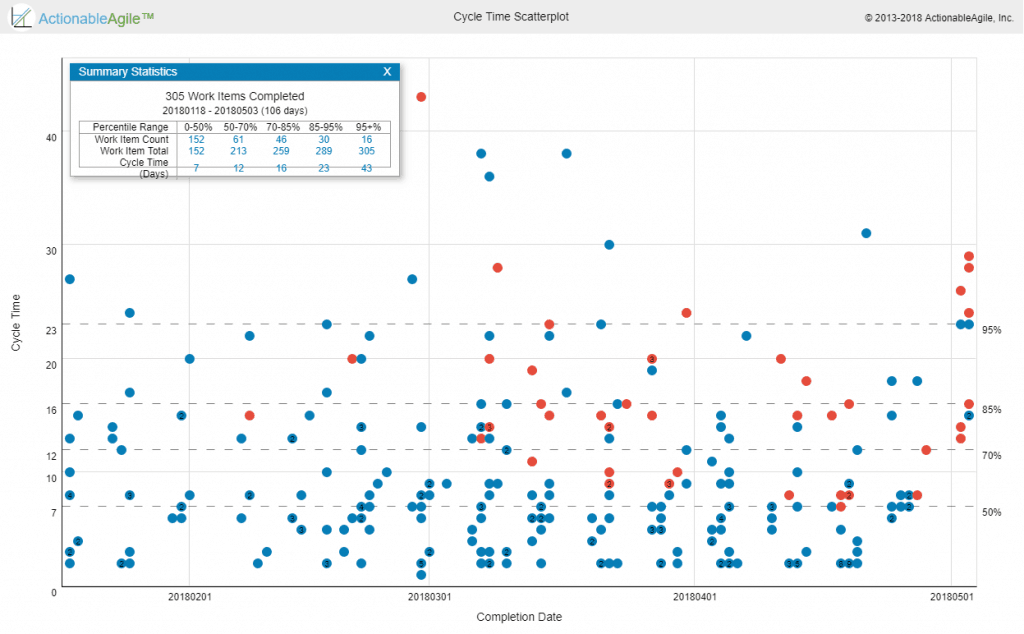
Cycle time is mentioned briefly in SAFe but the SAFe practitioner would benefit from taking a deeper look at charts/reports used to visualize and analyze Cycle Times like the Cycle Time Scatterplot where teams can understand their Cycle Time trends, and distributions, and look at anomalies.
Throughput
The number of work items “finished” per unit of time.
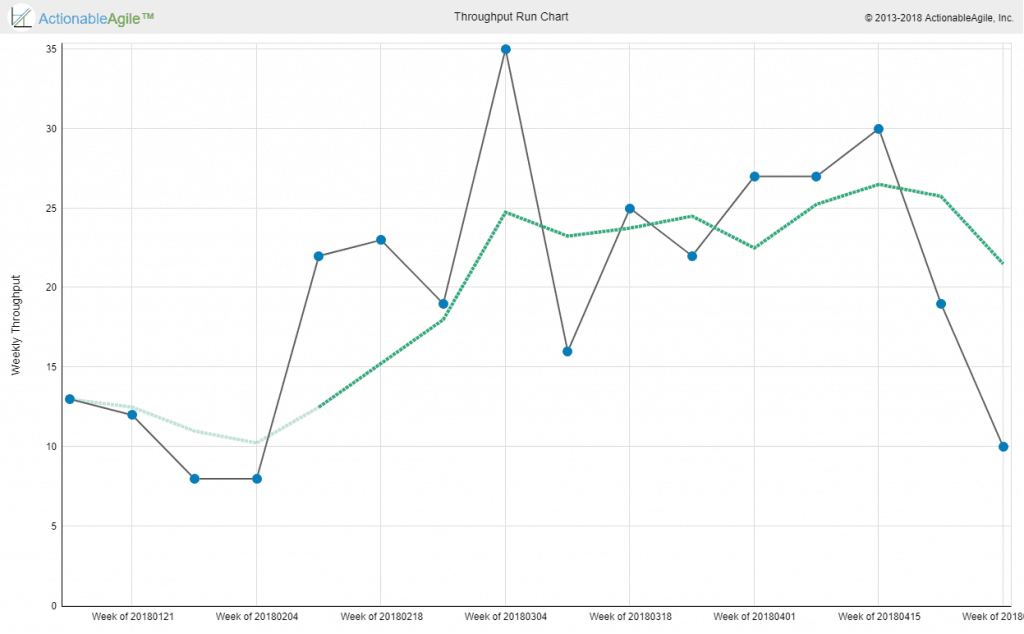
Note the measurement of throughput is the exact count of work items, without any compensation for item size – which is a major difference between throughput and story-points-based velocity. Throughput is measured at a certain step in the workflow, typically at the finish line of the workflow. Throughput can be visualized via a separate run chart or by looking at the angle of curves on a Cumulative Flow Diagram.
While it does include throughput in its list of metrics, Classic SAFe emphasizes measuring Velocity for the purpose of planning. My advice to SAFe practitioners is to start to track throughput and compare its predictive powers to those of velocity and either combine the two approaches in order to improve their predictability (e.g. during PI Planning / Roadmapping) or choose one that works better in their context. (Read more about this in my earlier blog post about SAFe Without Estimates)
Work Item Age
The amount of elapsed time between when a work item “started” and the current time.
WIP and Cycle Time are classic metrics every Kanban/SAFe practitioner is probably familiar with and throughput is somewhat similar to Velocity.
Work Item Age is the new guy on the block. Work Item Age complements Cycle Time. If Cycle Time is a lagging indicator only relevant for finished items, Work Item Age is a leading indicator only relevant for non-finished items. The basic idea is to provide transparency to which items are flowing well and which are sort of “stuck” even if not formally blocked.
I’ve been using some variant of this metric with most Kanban teams I’ve worked with. I also worked with several Kanban tool vendors to introduce some way to visualize card/item age.
Age on its own is interesting but not enough. We also want some indication of flow health. One common thing to visualize is the age of the current step in the workflow also known as “cards that didn’t move recently”.
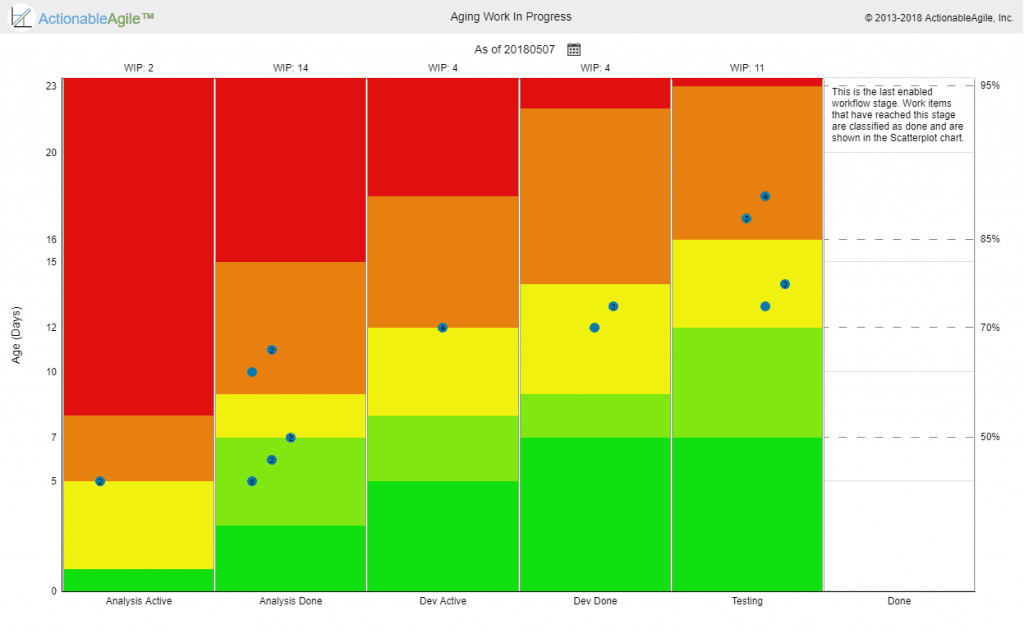
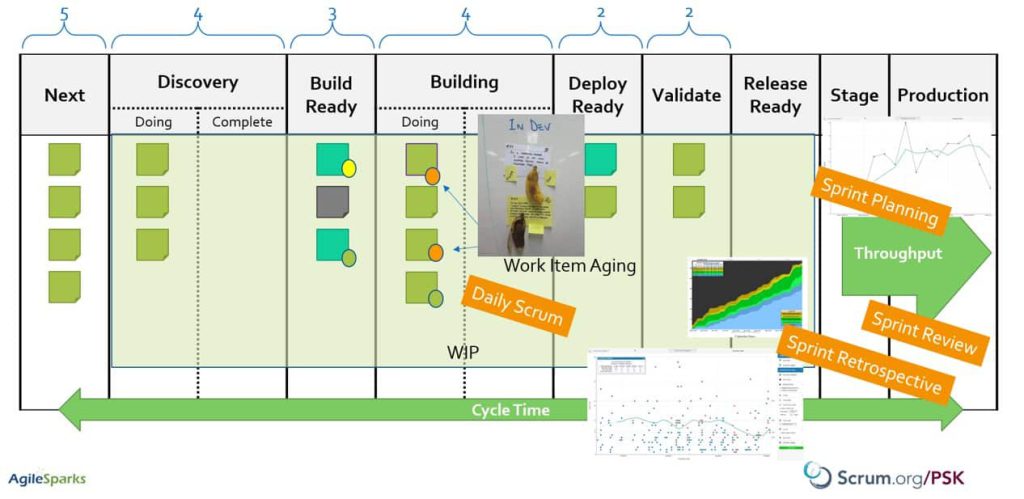
Another way to look at it would be to look at the overall age but combine it with where the work currently is in the workflow as well as what the team expects their cycle time to be (We call that expectation Service Level Expectation (SLE) in the Kanban Guide for Scrum teams and the PSK class). Combining all this information can help the team focus on the items that are at the most risk of missing the team’s expectations/SLE. For example, let’s say a team has an SLE of 16 days with 85% confidence. If one of the cards on their board has an age of 10 days, is that ok? is it a problem? The answer is that it depends. If that card is very close to the end of the workflow it is probably not a problem. If it is very close to the start of the workflow it is probably an indication of a problem that requires attention. The “Aging Work in Progress” chart below provides this perspective of both where active items are in the workflow, what the typical cycle times for this team are, and based on that which items are indications of flow risks (obviously orange-red means very low probability of finishing within the team’s flow expectations).
To sum up – Work Item Age is the best metric to look at if you want to determine when an item that has already started is going to finish. This is in contrast to an item that hasn’t started – where your best bet is your historical Cycle Times. The Service Level Expectation is just an expectation set by the team to themselves answering the question “What Cycle Time do we expect to see for an item of this type, and what is our confidence level for this?”.
Note: The charts above were created using the demo version of ActionableAgile Analytics – a tool created by my co-steward of the Professional Scrum with Kanban class – Daniel Vacanti. You can access the demo yourself and play with these metrics and think about how they would help your Agile team, SAFe ART/ST, or portfolio. Note that the definition of Workflow in this chart is just one example of how your workflow might look like. Each team would define its Workflow according to its context.
Using the Flow metrics in SAFe’s team-level
First, we need to discuss how to even apply these metrics at the team-level. On the face of it, should be quite trivial because this is familiar ground – The Team Backlog and Iteration Backlog are pretty familiar to the Product Backlog and Sprint Backlog. And yet a good question raised by Travis Birch in a Linkedin thread about this is “Where in the workflow of these items do we start to measure cycle time and include the item in WIP?”.
In general, at the SAFe team level most work is represented by User Stories that are a breakdown of a Feature from the Program Backlog / Program Kanban. These User Stories start their life on the Team Backlog as the story is identified during the feature breakdown. I would typically consider the item started once the team starts to refine the story in prep for an actual iteration. This means that story identification and high-level assignment to Iterations during PI Planning aren’t considered actively working on the User Story yet. The same would apply to other items in the Team Backlog.
When should we consider items in the team-level Kanban board finished and out of WIP and stop the clock on cycle time? At the moment they are done according to the team-level definition of Done. Typically – once they finish fixing whatever problems they find in story-level testing and the story is accepted. At this point, these Stories sit and wait for their friends in the feature to join them, and only then does the Feature move along. but from the Story-level perspective, their workflow is already finished.
So now that we’ve mapped the metrics to the team level how can these flow metrics be used to improve the Scrum events used at SAFe’s team level? This is one of the key learning objectives in the Professional Scrum with Kanban class. In a follow-up discussion with some of the Professional Scrum Trainers who attended one of these classes, we came up with a matrix mapping the metrics to the events. (credit Maarten Kossen)
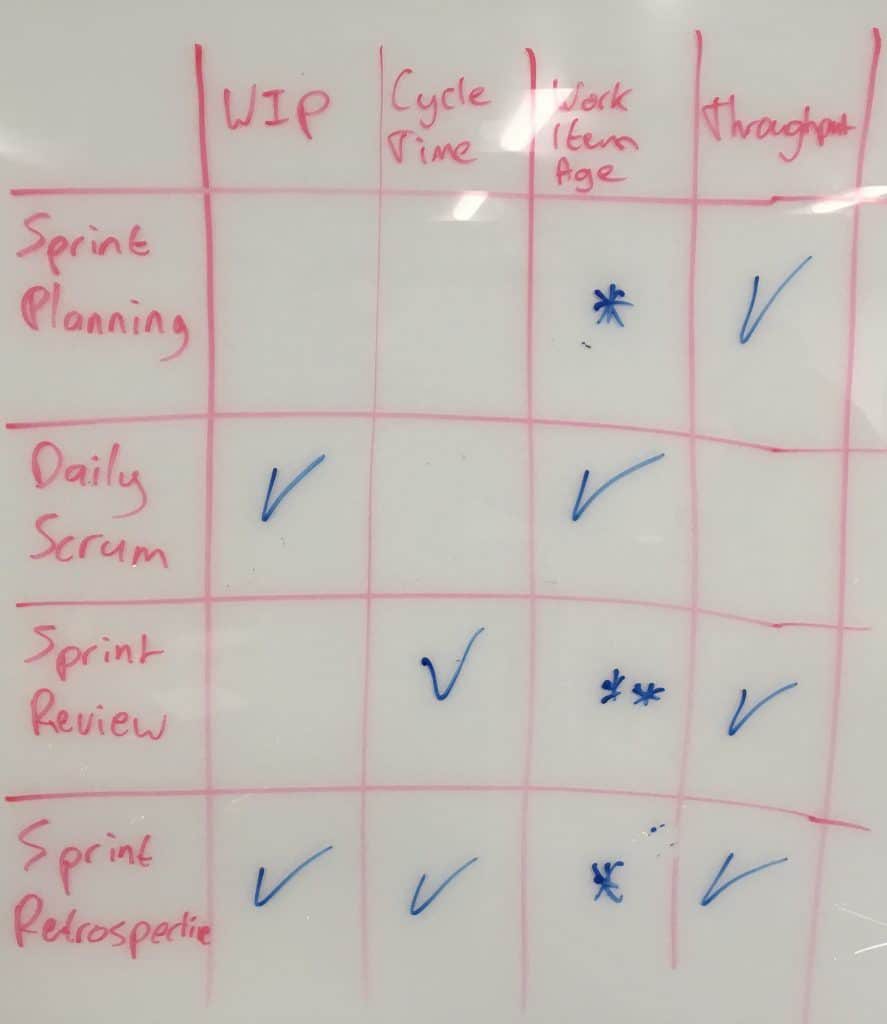
I’ll explain (using SAFe’s names to help map to SAFe):
Iteration Planning mainly leverages Throughput in order to create a realistic forecast for the Iteration Backlog. Work Item Age might be relevant when you have some items leftover from the previous Sprint and you want to decide what to do about them.
The focus of Daily Standup is the ongoing flow within the Iteration so naturally what we care about is what’s currently going on. Therefore, Current WIP and Work Item Age are the most important metrics in the Daily Standup.
Iteration Review includes a review with stakeholders of both the Increment as well as overall flow behavior of the team – trends in Cycle Times and Throughput are interesting. Throughput can also be used as part of release planning/road-mapping discussions, especially when combined with Monte-Carlo simulations providing some better visibility/confidence into “What can be done by when”. NOTE: It is always important to emphasize that these are projections/forecasts, not commitments.
Iteration Retrospective is all about inspecting and adapting the process and the workflow. Therefore it is the place to look at WIP, Cycle Times, and Throughput from the perspective of looking for areas to improve.
Applying the Metrics in SAFe’s Program/Large Solution Level
So far it was an easy mapping because SAFe uses Scrum events at the team level. How about using these flow metrics at the Program level on your Agile Release Train?
SAFe’s program-level kanban items are features/enablers. The wider perspective here would be to consider their work in process and measure cycle time from the moment we identify them during Exploration to the moment they’ve been released, all the way through Integration and Deployment all throughout the SAFe Continuous Delivery pipeline. In many environments though, this would be a very long time (especially when Continuous Delivery is just an espoused vision) and it would be interesting to understand the WIP and cycle time in each one of these major stages.
When it comes to program-level events – Program Increment (PI) Planning should mainly leverage Throughput in order to create a realistic forecast for each team’s capacity in their iterations. Work Item Age might be relevant when you have some items leftover from the previous PI and you want to decide what to do about them.
Beyond looking at throughput at the team level, it is interesting to track throughput at the Program-level. One could argue that at this level it makes more sense to take into account Feature size because Features are so varied in size. I’d argue you want to also look at throughput because as we know from WSJF we want to reduce batch size and deliver more frequently and analyzing throughput helps us see how far we are from that vision.
The focus of Scrum of Scrums / ART Sync is the ongoing flow across the program during the PI so naturally what we care about is what’s currently going on. Therefore, Current WIP and Work Item Age are the most important metrics in the SoS/ART Sync. We should pay attention both to overall trends for story-level Age across teams, as well as Feature-level Age on the Program Kanban board, and look for features that are aging dangerously.
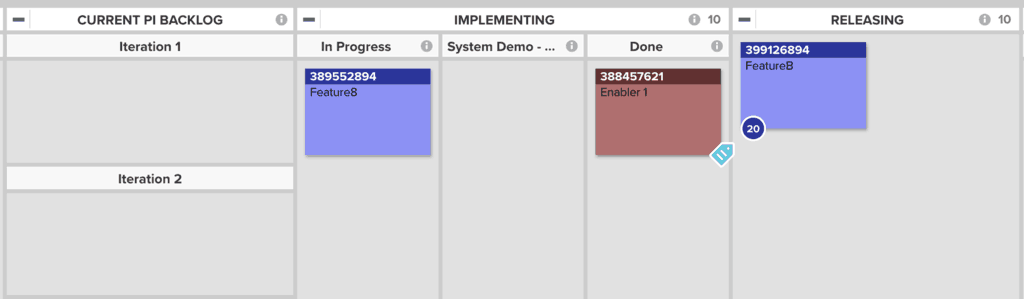
In order to get better visibility of the flow of features, I like to split the “Implementation” stage in the Program Kanban Board into some interim stages that reflect the state of the feature. One way to do that is to add a “System Demo” or “Alive” lane that reflects whether this feature was demonstrated already – which means it’s not complete yet but we’ve seen some of it working. You might come up with other ways to split “Implementing” but be careful of having a “Design” “Build” and “Test” split because we don’t want to develop the Feature using waterfall – what we want to see is stories in different stages of the development cycle while the feature is in implementation. you could have a “first story demonstrated” lane and a “final stretch” lane if you want…
System Demo in SAFe focuses on the demonstration of the System Increment. An aspect in the Scrum Guide that SHOULD be added is a review with stakeholders of both the System Increment as well as the overall flow behavior of the ART – trends in Cycle Times and Throughput are interesting and can be used to adjust the plan for how to deliver the PI objectives.
Inspect and Adapt is all about inspecting and adapting the process and the workflow. Therefore it is the place to look at WIP, Cycle Times, and Throughput from a perspective of looking for areas to improve at both an aggregative team-level view as well as a Feature-level view.
Applying the Metrics to the Portfolio Level
The portfolio doesn’t have a prescribed cadence of events, but you could see how metrics such as Cycle Times, WIP, Aging, and throughput could complement your perspective and help you visualize, limit, and reduce WIP as well as improve Innovation Flow at the portfolio level.
The Human Aspect Of Metrics
One of the key tenets in SAFe AND Scrum is Respect. Respect for people and culture. When introducing any sort of new practice including flow metrics we should respect people and invite them to try these metrics rather than force it upon them. One of the key points the Scrum Guide and the Kanban Guide for Scrum Teams emphasize is the fact that the team owns their definition of Workflow and what metrics they use. The team is the Dev team when it comes to the SAFe Team level, the ART when it comes to the Program level, and so on.
IF we introduce the metrics to the team this way and invite them to engage, my experience shows that their collaboration, engagement, and the inclusion of the whole team in tackling issues grow as a result.
Of course, if we force/mandate these metrics and use them to micro-manage the team into submission then your mileage may vary somewhere between mutiny, Italian strike (Work-to-Rule), or just lower engagement/motivation. Aiming to smooth flow also results in diversifying the knowledge and skill level in the team and reduces the dependency on specific team members and heroism.
(Thank you Simon Powers for making sure I tackle this in this post!)
There’s more to Kanban than you find in SAFe’s curriculum
And that’s natural and expected. SAFe is a framework, it cannot include everything. It introduces many people to Kanban and then invites them to go on a lifelong learning journey. Hopefully, this journey includes exploring in more depth bodies of work like the Scrum Guide and now the Kanban Guide for Scrum Teams and deeper Kanban understanding in general. SAFe practitioners especially interested in metrics should definitely check out Daniel Vacanti’s book and workshop.
NOTE: I’m planning a special Professional Scrum with Kanban class for SAFe practitioners. This will be a formal PSK class with exercises and discussions exploring SAFe-specific contexts at the team and program levels. If you’re interested, drop me a note over at the AgileSparks PSK page.